
The equity markets corrected this week, with all the major stock indexes closing down. The highflyers of the last few months were hit the hardest (I was going to say of course they were, but that’s not necessarily been the case in the past), and for once the equal-weighted S&P index beat out the cap-weighted version (-0.4% versus -1.9% for the week).
Two factors are probably playing a role in the selloff.
First, the ongoing government shutdown is certainly playing a part. Furloughed workers, TSA delays, cancelled flights…..the consequences are starting to be felt. Looking at things from a narrow market perspective, liquidity is starting to dry up as well.
How? The government’s main bank account—the Treasury General Account, or TGA—is held at the Federal Reserve. In normal times it collects taxes and the proceeds from bond sales, then sends the money right back into the system through paychecks and all the other spending that keeps things moving. But now only one side of the equation is working. Taxes keep coming in (after all, it is one of the two certainties in life), but the spending side freezes solid. Paychecks aren’t deposited at the bank, banks have fewer funds to lend, and the flow into money funds slows or even reverses as government workers and contractors run down their cash balances.
The chart below shows the size of the TGA account – it just surpassed $1tn hinting at how much cash is being kept out of the system. Outside of the COVID months, this is the highest balance in recent history.
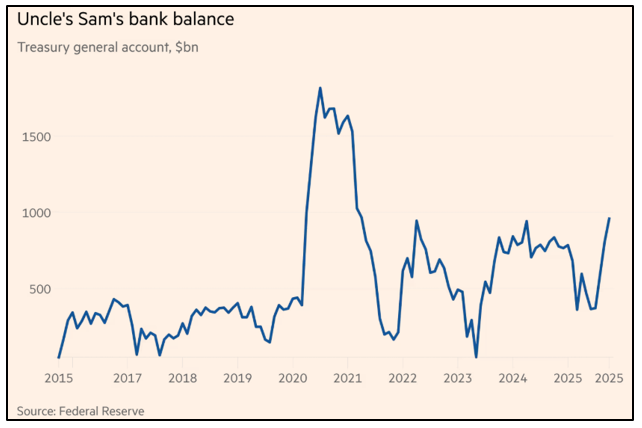
For the markets, what this means is that liquidity is tightening during the shutdown.
The Numbers are Enormous!!
The second issue behind the market correction is the evolution of the AI story. This week OpenAI’s Sam Altman got a lot of attention when he called for a government backstop for its investment in data centers. This stirred up a hornet's nest, and Altman backtracked on his comments on Friday. But Paul Kedrosky captured the change in mood:
“The recent flare-up around OpenAI’s semi- proposed debt backstop reveals the structural tension between venture-style growth and infrastructure-scale spending, especially when the two become wrapped in the flag. The company's CFO’s comments floated the idea of a government guarantee for data-center financing — a remarkable signal that AI build-out costs have reached utility proportions. Sam Altman’s follow-up disavowed any such plan, saying OpenAI should “fail if we get it wrong,” but the damage was done. Investors now see an enterprise straddling the line between startup and state-sponsored critical infrastructure, with an overlay of an implied "Greenspan put"—that AI is so important it can't be allowed to fail.
The optics matter: lenders must begin to price OpenAI more like a sovereign-backed utility than a growth company. The episode marks the point where AI financing entered the quasi-public domain. Even if the “backstop” was rhetorical, it exposed how fragile the capital structure behind this compute-intensive ecosystem has become.”
And just to put into perspective how much money we are talking about, Morgan Stanley estimates that roughly $3 trillion will be invested in data centers over the next few years. Roughly half of this is likely to be financed through debt issuance.
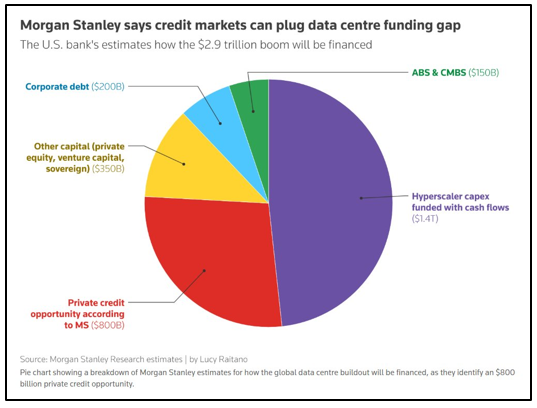
That’s a lot of debt to digest, especially with a revenue model that can be charitably characterized as ‘yet to be proven.’
AI and Labor – Questions Abound
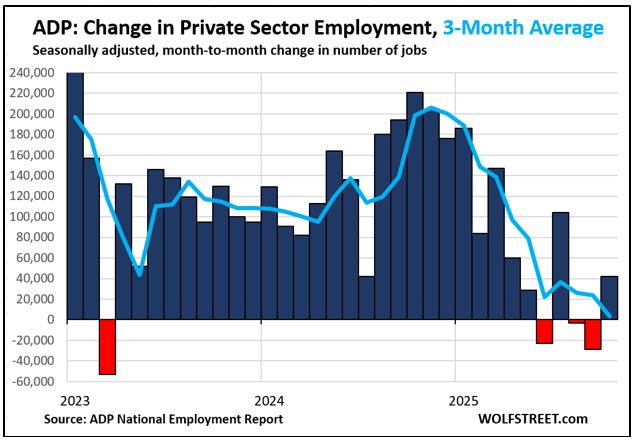
One consequence of the government shutdown is that several high-profile economic stats have gone missing in action. For example, we haven’t had a payrolls/unemployment report since early September (that covered August). What data we have had since then tells a mixed picture.
For example, this week’s ADP private sector employment estimate for October showed a gain of 42,000 jobs, with service-providing firms adding 33,000 and goods-producing firms adding 10,000 positions. Of course, as the name suggests, government furloughs are not in this index.
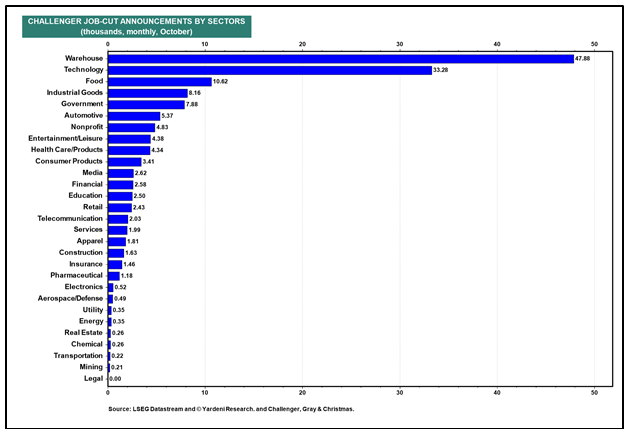
But also this week we also got the Challenger report on layoffs. As you can see below, they spiked higher in October.

Now in an economy with roughly 160 million workers, layoffs of around 150K don’t move the needle much. But it’s all the data the markets have to go on, so the markets will react to it.
What’s interesting is that the October layoffs were centered in two areas thought to be susceptible to AI/automation – warehouse work and tech jobs.
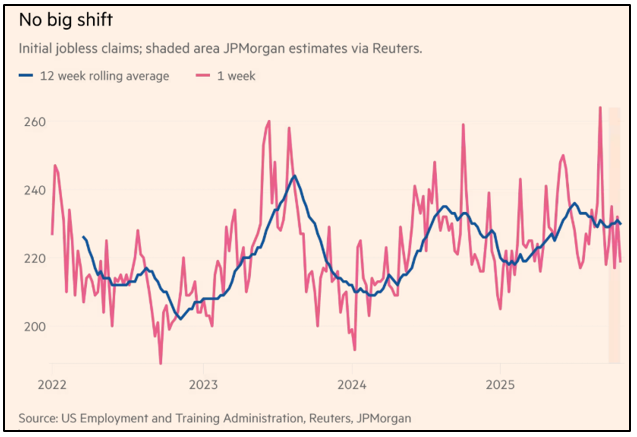
Despite the layoff numbers, though, weekly unemployment claims haven’t moved much, as you can see below. And this is probably the number to watch because it’s probably the most reliable read on the jobs market.
(Other) Charts We Found Interesting
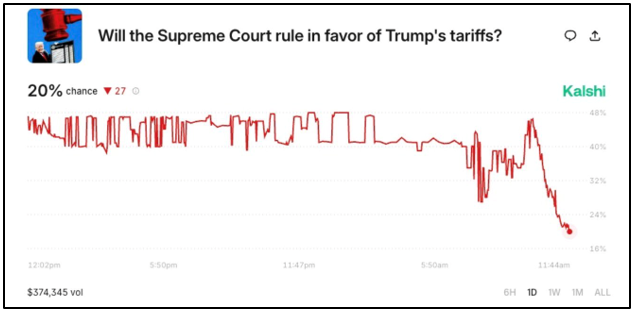
- There’s a growing likelihood that some of the ‘Liberation Day’ tariffs could be invalidated by the Supreme Court.
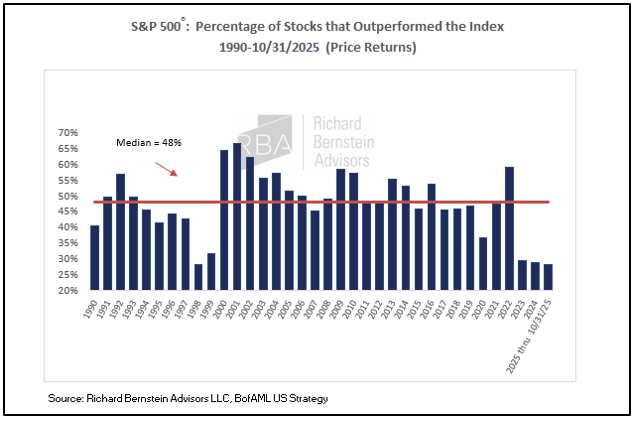
- The markets haven’t been this narrow in decades – the vast majority of S&P 500 stocks have underperformed the index for almost three years.
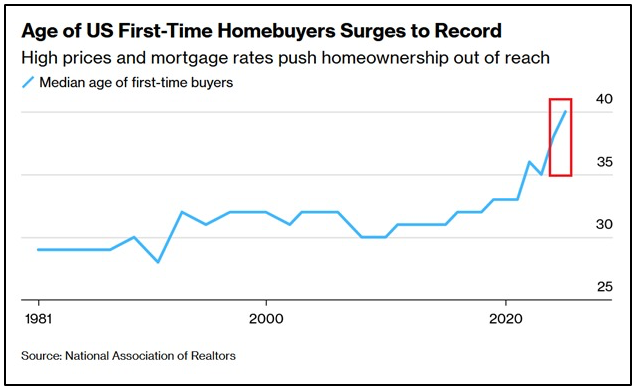
- The average age of the first-time home buyer hit 40 – the highest ever!!
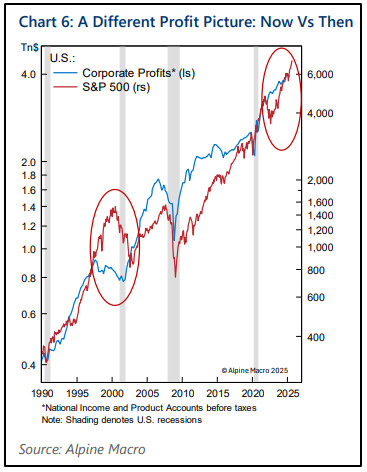
- For all the talk about the broad markets being in a bubble, underlying earnings growth has been solid. This stands in stark contrast to the tech bubble in the late 1990s.
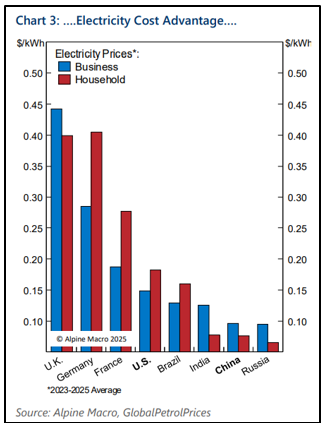
- If AI is the future, and the future of AI hinges on access to cheap energy, parts of Europe are facing an almost insurmountable headwind.
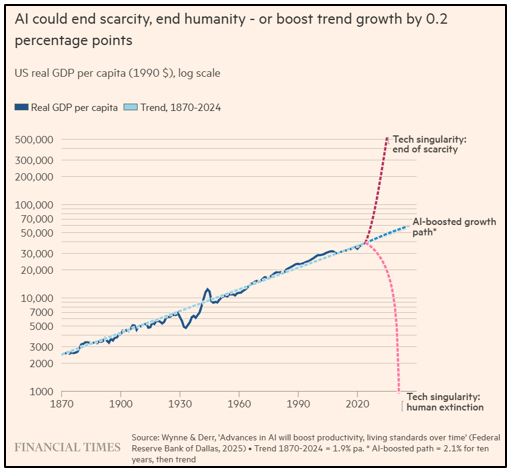
- One last (somewhat) tongue-in-cheek AI chart – or, ‘predictions are hard, especially about the future.’
Have a good weekend
Charles Blankley
Published by Gemmer Asset Management LLC. The material presented (including all charts, graphs and statistics) is based on current public information that we consider reliable, but we do not represent it is accurate or complete, and it should not be relied on as such. The material is not an offer to sell or the solicitation of an offer to buy any security in any jurisdiction where such an offer or solicitation would be illegal. It does not constitute a personal recommendation or take into account the particular investment objective, financial situations, or needs of individual clients. Clients should consider whether any advice or recommendation in this material is suitable for their particular circumstances and, if appropriate, see professional advice, including tax advice. The price and value of investments referred to in this material and the income from them may fluctuate. Past performance is not a guide to future performance, future returns are not guaranteed, and a loss of original capital may occur. Fluctuations in exchange rates could have adverse effects on the value or prices of, or income derive from, certain investments. No part of this material may be (i) copied, photocopied, or duplicated in any form by any means or (ii) redistributed without the prior written consent of Gemmer Asset Management LLC (GAM). Any mutual fund performance presented in this material are used to illustrate opportunities within a diversified portfolio and do not represent the only mutual funds used in actual client portfolios. Any allocation models or statistics in this material are subject to change. GAM may change the funds utilized and/or the percentage weightings due to various circumstances. Please contact GAM, your advisor or financial representative for current inflation on allocation, account minimums and fees. Any major market indexes that are presented are unmanaged indexes or index-based mutual funds commonly used to measure the performance of the US and global stock/bond markets. These indexes have not necessarily been selected to represent an appropriate benchmark for the investment or model portfolio performance, but rather is disclosed to allow for comparison to that of well known, widely recognized indexes. The volatility of all indexes may be materially different from that of client portfolios. This material is presented for informational purposes. We maintain a list of all recommendations made in our allocation models for at least the previous 12 months. If you would like a complete listing of previous and current recommendations, please contact our office.